
Authored by Charles Hugh Smith via OfTwoMinds blog,
Statistical games can be played to mask the realities of our neofeudal economy, but “narrative control” can’t obscure the facts or the banquet of consequences that these realities have set.
Not everyone in America gained ground as a result of the rampant hyper-financialization and hyper-globalization of the 21st century. Let’s begin our analysis of who gained ground and who lost ground in the year 2001, when China entered the WTO (World Trade Organization) and offshoring / globalization shifted into high gear and when the Federal Reserve began ramping up its financialization / monetary manipulation–oops, sorry, policy interventions.
The top 1% and the top 10% gained ground. The bottom 90% lost ground, especially the bottom 50%. Wage earners lost ground, while corporate insiders, financiers, speculators using leverage and those lucky enough to be born long enough ago to buy assets at pre-bubble valuations gained ground.
If you want to argue with these facts, argue with the Federal Reserve Database. All these charts are drawn from the St. Louis Federal Reserve FRED Database.
Let’s start with the varying multiples generated by asset bubbles since 2001.
Those are some serious bubbles, given that $1 in 2001 is $1.80 in today’s currency.
If the NASDAQ index had risen at the same rate as inflation since 2001, it would be 3,340, not 17,166.
Corporate profits would be $1.26 trillion annually, rather than $4.3 trillion. Hmm, $3 trillion a year is a nice chunk of extra change for gutting national security, quality and durability by offshoring essential industries.
The Case-Shiller Housing Index would be up from 110 in 2001 to 200 today, rather than 323.
So how did each household sector do since 2001?
-
Net worth of top 1% up 5X
-
Net worth of 90-99% up 3.9X
-
Net worth 50-90% up 3.2X
-
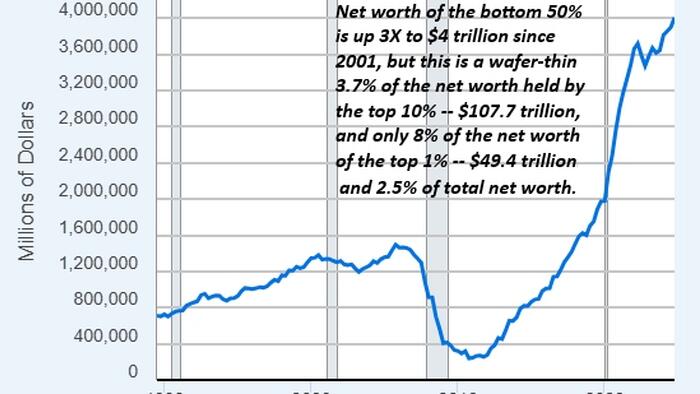
Net worth bottom 50% up 3X
How much of the nation’s total household net worth does each sector own now in dollars?
Note that the top 1% own roughly the same net worth as the bottom 90%.
How much of the nation’s total household net worth does each sector own now as a percentage of total net worth?
Since wealth is concentrated in the top layer of each sector–the top 1% own the lion’s share of the top 10%’s net worth, and the top 10% of the 50% to 90% sector own the lion’s share of that sector’s net worth–we can say with confidence that the top 20% own roughly 80% of the net worth–in line with the Pareto Distribution (the 80/20 rule).
What’s lost in this aggregate number is the extreme concentration of income-producing wealth (and thus political power) in the top 0.1% of the citizenry and the mere crumbs left to the bottom 60%. As many of us have pointed out over the past 15 years, the only accurate description for this system is neofeudal, where a New Nobility owns the wealth and political power, the bottom 80% are modern-day debt-serfs and the “middle class” is now the 90% to 99% sector, with those in the 80% to 90% sector having just enough home equity to fancy themselves “middle class” in name if not in ownership of income-producing assets or political influence.
What do we call a system in which the top 1% own roughly the same net worth as the bottom 90%? Neofeudal. Any other description is misdirection / propaganda aimed at protecting the interests of the Nobility at the expense of the serfs.
The NASDAQ stock market index: up 10X at its recent peak.

Corporate profits up 6.2X as surveillance pricing, monopoly price-gouging, crapification, planned obsolescence and extortion have worked marvelously well in stripmining the citizenry to enrich the top 10% who own 90% of all stocks, the “shareholders.”

Wage earners’ share of the nation’s income has been slashed over the past five decades. Unsurprisingly, hyper-financialization and hyper-globalization did nothing to reverse this decline of American labor in favor of global capital.

If housing fell 40% from its current valuation, it would return to the trend line.

Here’s a chart of net worth since 1950. Approximately $100 trillion was added above and beyond what inflation dictated.

Some percentage of the bottom 50% benefited from the housing bubble, but even with the bump to $4 trillion in net worth, the bottom 50% owns a grand total of 2.5% of total net worth.

Here’s the 50% to 90% sector:

Here’s the 90% to 99% sector:

Here’s the top 1% sector:

Statistical games can be played to mask the realities of our neofeudal economy and society. But narrative control by the well-paid apologist-punditry class–everyone’s doing great because I’m doing great–can’t obscure the facts or the banquet of consequences that these realities have set.
* * *
Loading…


