
The first quarter was an incredibly tumultuous period for markets, with the S&P 500 posting its biggest quarterly decline since 2022.
The main driver of the market volatility according to DB’s Jim Reid, was an aggressive round of tariffs, as President Trump launched measures going well beyond his first term, with reciprocal tariffs still looming on April 2. Otherwise, the release of DeepSeek’s AI model early in the quarter led to growing questions about big tech valuations, and the Magnificent 7 ended the quarter in bear market territory.
But it wasn’t all bad news, and European equities saw a significant outperformance thanks to a huge fiscal regime shift towards higher defense spending. In fact, Q1 marked the biggest quarterly performance gap between the STOXX 600 and the S&P 500 in a decade, and the biggest underperformance of the US vs the rest of the world in 23 years.

Nevertheless, the overall tone was generally risk-off for markets, and as the conversation turned increasingly towards stagflation, gold prices posted their biggest quarterly gain since 1986.
Quarter in Review – The high-level macro overview
Despite the disappointing overall performance, “Queasy Q1” actually got off to a decent start in January. For instance, data over the first couple of weeks pointed to robust growth and demand pressures, including in the US. For instance, the ISM services print was up to 54.0 in December, exceeding expectations, and the prices paid indicator moved up to 64.6, the highest in nearly two years. Then the US jobs report for December showed nonfarm payrolls up by +256k, a nine-month high. And that’s since been revised up to +323k, making it the strongest month since February 2023 on current revisions. Indeed, it also meant there was a sizeable bond selloff in early January, with the 10yr Treasury yield surpassing 4.80% intraday for the first time since late-2023. But that rapid rise in yields reversed course after the US CPI print wasn’t as bad as some feared, raising hopes that the Fed would still cut rates this year.
However, after a strong start in January, markets began to show signs of wobbling towards the end of the month. One of the most important developments was the release of DeepSeek’s new AI model, which raised questions as to the sustainability of big tech valuations in the US. The initial market impact was felt on January 27, with the NASDAQ down -3.07% that day, while Nvidia fell -16.97%. And even though that sharp selloff for the NASDAQ quickly unwound, it raised doubts about the narrative of US tech exceptionalism that had powered the equity market’s advance for the last couple of years. Then in February, Nvidia’s earnings showed the smallest revenue beat in two years, which was underwhelming for investors used to much bigger upside surprises.
Late-January also saw one of the biggest stories of the quarter begin, which was the widespread imposition of tariffs by the United States, after the new Trump administration arrived in office on January 20. Initially, they said that 25% tariffs would be imposed on Canada and Mexico, which led to a risk-off move on February 3, but those were extended by a month at the last-minute, and investors became increasingly relaxed about how things might develop. Indeed, the S&P 500 moved up to an all-time high on February 19, at which point it was up +4.6% in total return terms on a YTD basis.
But as the tariff uncertainty began to mount, markets began to experience much larger risk-off moves. For example, the extension for Canada and Mexico ended, and 25% tariffs were imposed on both on March 4, whilst the additional tariff on China was raised from 10% to 20%. Separately, tariffs on steel and aluminium were imposed at 25% on March 12. And looking forward, investors are still awaiting the reciprocal tariffs, which have been scheduled for April 2.
The tariffs also meant investors became increasingly concerned about higher inflation, which exacerbated existing fears given inflation was still lingering above target across the major economies. For example, the US 1yr inflation swap moved up +72bps in Q1 to 3.25%, its highest level in two years, and the biggest quarterly jump in three years. Moreover, consumers’ inflation expectations also moved higher, and the University of Michigan’s long-term measure moved up to 4.1% in March, the highest since February 1993. Matters weren’t helped by the latest PCE inflation data, which is the Fed’s preferred measure of inflation, where the 3m annualised rate of core PCE was running at +3.6% in February, the highest since March 2024. And at the same time, there were also growing concerns about the US growth outlook, and even mounting speculation about a recession. For instance, the Conference Board’s consumer confidence measure fell to just 92.9 in March, the weakest since January 2021. And the expectations measure fell to 65.2, the lowest since March 2013.
These fears about stagflation led to a clear risk-off move, which gathered pace towards the end of the quarter. So the S&P 500 was initially up +2.8% in January in total return terms, but in February it was down -1.3%, and then in March it fell -5.6%, marking its worst monthly performance since 2022. And for the quarter as a whole, the index was down -4.3%, marking its worst quarterly performance since Q3 2022, back when the Fed were still hiking by 75bps per meeting to deal with rapid inflation.

Those losses were particularly concentrated among tech stocks, and the Magnificent 7 ended the quarter down -16.0%, having shed -20.7% since its December peak. The US Dollar itself also struggled, with the dollar index down -3.9% in Q1, whilst the Euro was up +4.5% against the US Dollar to $1.08.
While all that was going on in the US, Q1 also saw an incredible fiscal shift in Europe as the continent moved towards significantly higher defense spending. That followed the German election on February 23, where the incoming coalition proposed a reform of the constitutional debt brake to permit higher defense spending, alongside a €500bn infrastructure fund. Meanwhile at the EU level, the Commission proposed that member states could significantly increase defense spending without triggering the EU’s deficit rules.
The prospect of a significant fiscal stimulus had an immediate impact among European assets. In fact, the announcement saw the 10yr bund yield post its biggest daily jump since German reunification in 1990, moving up +29.8bps in a single day on March 5. Over the quarter as a whole, the 10yr bund yield rose +37bps to 2.74%, and the German DAX was one of the strongest-performing European indices, up +11.3% in total return terms. Significant outperformers included the STOXX Aerospace and Defense Index, which surged +28.9%, whilst the German firm Rheinmetall was up +114.6%. Another result was a notable steepening in yield curves, with the German 2s10s curve moving up +41bps on the quarter to 69bps. And given the sharp policy divergence, Q1 saw the biggest quarterly performance gap in local currency terms between the STOXX 600 (+5.9%) and the S&P 500 (- 4.3%) in a decade.
Finally from central banks, Q1 saw a continued policy divergence across countries. The Fed kept rates unchanged in Q1, and continued to signal two cuts for 2025 in their March dot plot, just as they’d done in December. However, they did slow the pace of QT, with the runoff in Treasury holdings to slow from $25bn to $5bn from April 1. Over at the ECB, they delivered further 25bp rate cuts in both January and March, taking their deposit rate down to 2.50%. Meanwhile in Japan, the Bank of Japan delivered another hike in January, taking their policy rate up to 0.5%, and signalling further hikes ahead.
Which assets saw the biggest gains in Q1?
- Gold: With inflation concerns mounting, gold prices surged up to an all-time high of $3,124/oz, and their quarterly increase of +19.0% was the most since 1986.
- US Treasuries: The risk-off move and mounting speculation of a recession helped to support US Treasuries in Q1, with a total return of +2.9% over the quarter. The 10yr yield itself also moved down -36bps to 4.21%.
Which assets saw the biggest losses in Q1?
- US equities: In Q1, the S&P 500 was down -4.3% in total return terms, marking its worst quarterly performance since Q3 2022. Those losses were particularly clear for the Magnificent 7, which fell -16.0%.
- US Dollar: With investors moving out of US assets, the US Dollar struggled in Q1, and the dollar index itself weakened -3.9%. Conversely, the Euro strengthened +4.5% against the US Dollar to $1.08, marking its biggest quarterly jump since Q4 2022.
- Euro sovereign bonds: The prospect of higher spending led to a selloff among European sovereign bonds, with bunds down -1.8% in total return terms. That included a +37bps rise in the 10yr yield, which ended the quarter at 2.74%.
- Cryptocurrencies: The risk-off move meant it was a weak quarter for cryptocurrencies, and Bitcoin fell -12.1% to $82,421.
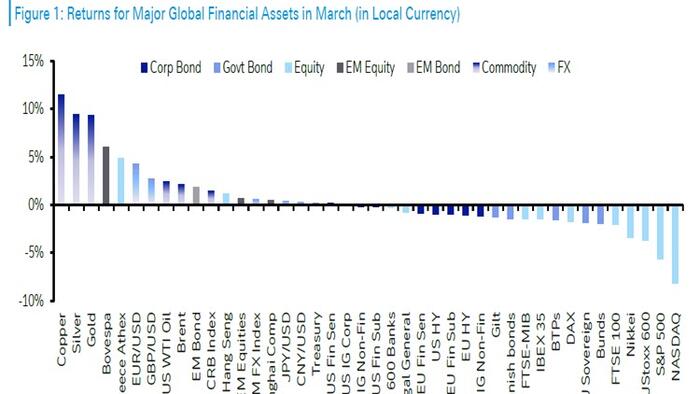
Here are the best and worst performing assets during the March Massacre…

… and here is Queesy Q1:

Source: Deutsche Bank
Loading…


