
Businessman and investor Kevin O’Leary recently described states such as New York, Massachusetts, New Jersey, and California as “uninvestable” with “insane” policies and taxes that are too high.REF O’Leary is not alone in his assessment. These states consistently rank at or near the bottom of the annual Chief Executive survey of the best and worst states for business.REF State and local income tax rates in California, New York, and New Jersey are two to three times higher than in most other states.REF In addition, these states have high regulatory burdens, high production costs, and a high risk of litigation.REF
Business migration out of these states is a common occurrence. California, New York, New Jersey, and Massachusetts are all in the top five of U.S. states losing population to interstate migration.REF Hundreds of companies have moved headquarters and jobs out of California alone.REF In August 2024, Chevron announced it would move its company headquarters out of San Ramon, California, and into Houston, Texas.REF Many other companies have recently moved headquarters from California to Texas, including CBRE Group, Charles Schwab, Hewlett Packard Enterprise, Oracle, and Pabst Brewing.REF Since 2020, Elon Musk has moved or announced plans to move five of his companies’ headquarters or core functions out of California and into Texas: Tesla, SpaceX, X, Neuralink, and the Boring Company.REF
It is not just corporations and the very wealthy who are fleeing from high-tax states. High-tax states lose almost 1 million people per year to lower-tax states, only a small fraction of whom are company CEOs or multimillionaires.REF Californians and New Yorkers from all walks of life have chosen to leave.
This report examines the magnitude of the migration out of high-tax states, the most common specific state-to-state migration flows, the relationship between different types of taxes and out-of-state migration, other factors in migration, and the relationship between income and migration out of high-tax states. It concludes with policy recommendations.
Voting with Their Feet
Moving across state lines comes at a significant cost, including the cost of the move itself, the time and resources spent finding new housing and sometimes new employment, the burden of leaving behind friends and family, and all the tedious and stressful details that come with such a major life change. For Californians, moving to another state can be especially costly because of their great distance from all but a few out-of-state population centers. The median out-of-state move for the 818,000 Californians who left the state in 2023 covered well over 1,500 miles.REF
Those who uproot and move across the country demonstrate a strong preference for living elsewhere by the costs that they are willing to absorb as they leave. However, millions of other Californians would move if it were less costly or if the right opportunity presented itself. A 2023 Strategies 360 poll found that 40 percent of Californians were considering moving out of the state,REF and the biggest factor was the state’s high cost of living.REF The question that the roughly 15 million Californians who are considering leaving must confront is whether the cost of living and other problems in the state are bad enough to justify the cost of moving.
Sadly for Californians, because there are so many more Americans leaving the state than moving into the state, they even have to deal with a persistent shortage of moving vans located in California. The shortage means that Californians must pay a premium to rent a moving van out of the state. At the time of this writing, for example, renting a 26-foot U-Haul truck for a move from Salt Lake City to Los Angeles would cost $719, but the reverse trip would cost $3,811.REF
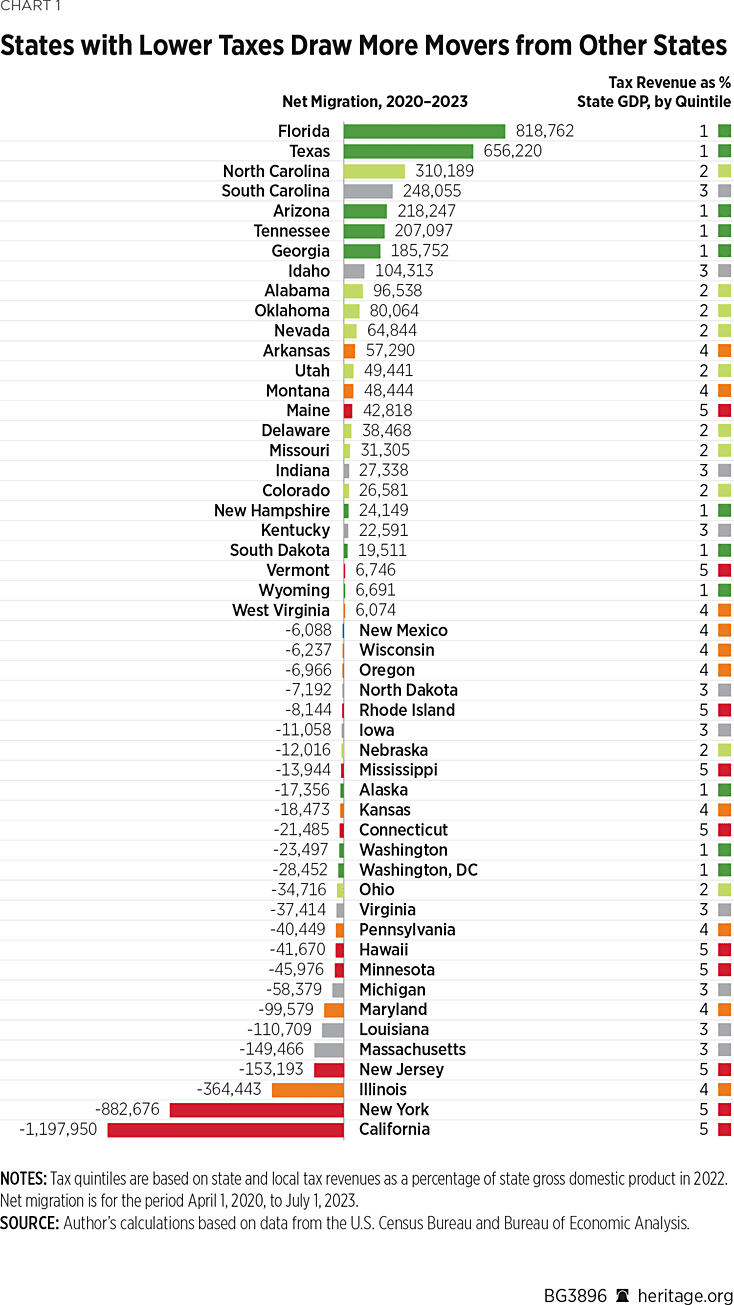
Despite the obstacles, nearly 1.2 million more Americans moved out of California to another state than moved to California between April 2020 and July 2023.REF New York lost 880,000 residents (net) to interstate migration during the same period. On the other hand, Florida and Texas—two states with no personal income tax—experienced net population gains from interstate migration of about 820,000 and 660,000 people, respectively. Domestic migration figures suggest that the southeastern United States and the Mountain West have been the most attractive regions of the country to move to in recent years.REF
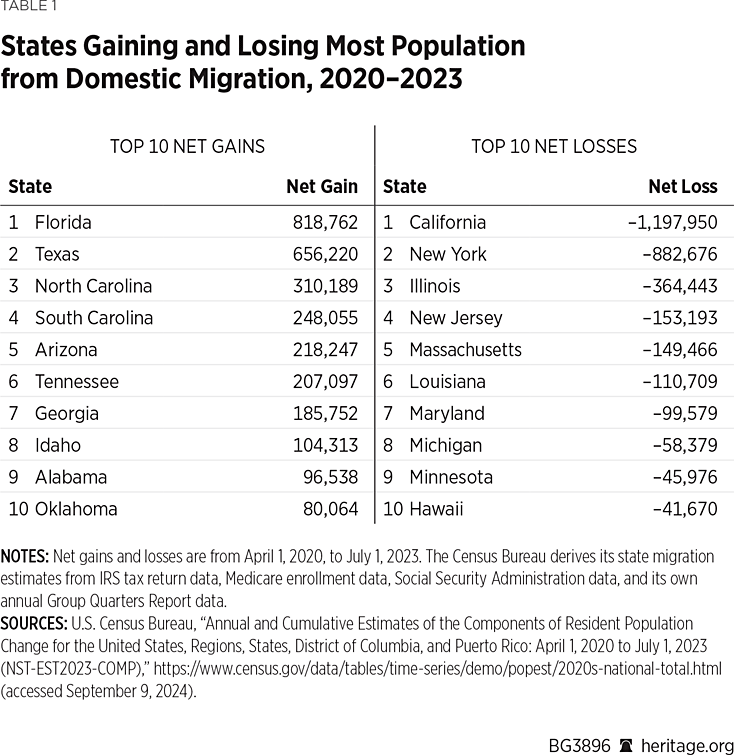
There may be no better simple measure of states’ desirability than their net population gain or loss from interstate migration. It shows how many people are willing to pay the necessary price to become residents of different states. Differences in public policies such as taxes, regulations, and criminal law enforcement affect how livable states are. Other factors outside state lawmakers’ control also affect interstate migration flows, including, for example, changes in global energy markets and changes in federal regulations that favor or disfavor certain states. Some point to climate and weather as an important driver in the migration to the southeastern United States, but this point is overstated. California’s sunny skies and year-round pleasant weather have done little to slow the recent exodus of its residents. Hawaii is also in the top 10 U.S. states for net outmigration.
Going with the Flow: Sources and Destinations of State-to-State Migration
The U.S. Census Bureau provides data on state-to-state population flows in its Annual Social and Economic Supplements (ASEC) survey, which collects information on people who have lived less than one year in their current residences. The state-to-state detail offers a more detailed picture of Americans’ moving patterns than the aggregate net domestic migration figures do.
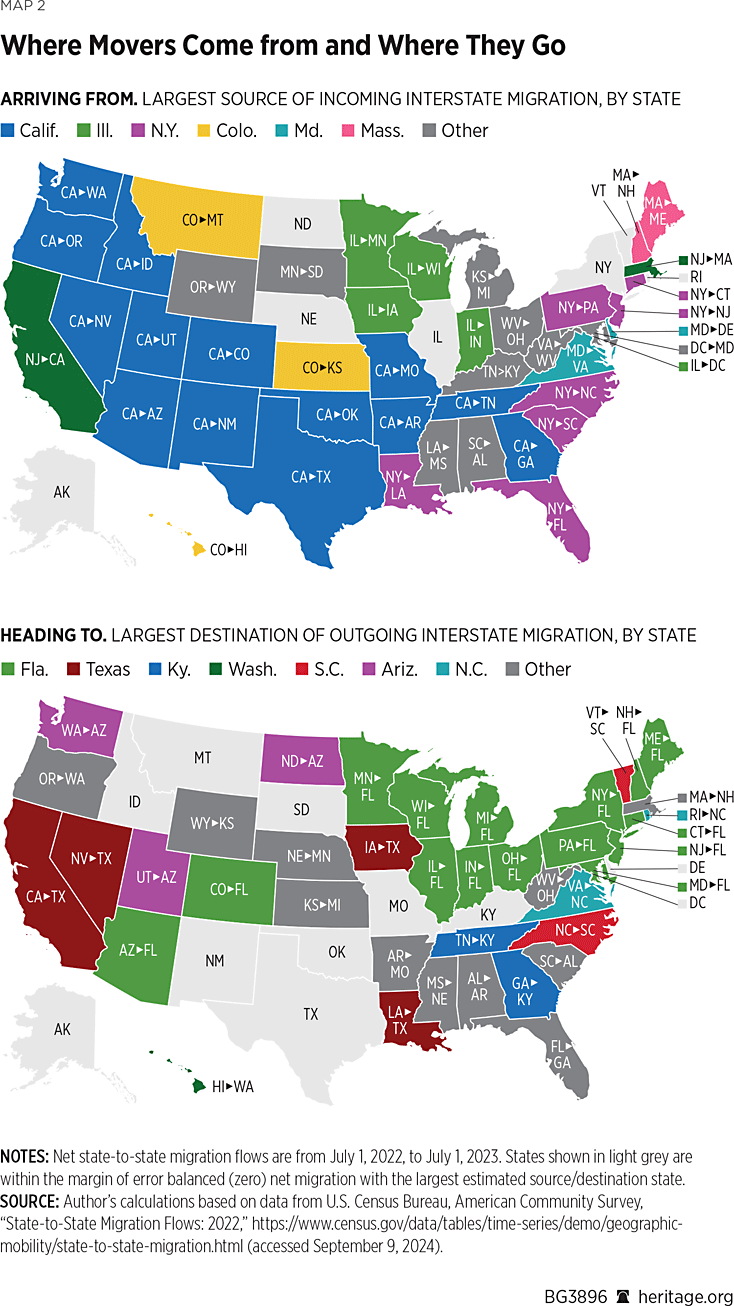
The top panel of Map 2 shows the state that was the biggest source of net domestic migration into each state in 2023. The map shows the largest population inflows on a net basis (not gross), so it does not list, for example, neighboring states with large population flows that are balanced in both directions. In 2023:REF
- California was the leading source of net domestic migration into every state whose center of population is within 1,000 miles of either Los Angeles or San Francisco. California was also the biggest source of net domestic migration to states as far away as Georgia and Tennessee.
- New York was the leading source of net domestic migration to many states on or near the Atlantic coast, including Florida, New Jersey, Connecticut, Pennsylvania, and the Carolinas.
- Illinois was the leading source of net domestic migration to four midwestern states: Indiana, Wisconsin, Iowa, and Minnesota.
- Colorado was the leading source of net domestic migration to Kansas, Montana, and Hawaii.
- Maryland was the leading source of net domestic migration to neighboring Virginia and Delaware.
- Massachusetts was the leading source of net domestic migration to New Hampshire and Maine.
- New Jersey was the leading source of net domestic migration to California and Massachusetts.
All other states besides those listed above were the leading source of net domestic migration into either zero states or just one state. The map does not name the leading source of domestic migration into some states (shown in grey) if they were within the margin of error of having zero (balanced) net migration with the leading source.
The bottom panel of Map 2 lists the state that attracted the most net domestic outmigration from each state in 2023:REF
- Florida was the largest attractor of net domestic migration from most of the states in the northeastern United States and the upper Midwest, as well as from Arizona and Colorado.
- Texas was the largest attractor of net domestic migration from four states west of the Mississippi: California, Louisiana, Nevada, and Iowa.
- Arizona was the largest attractor of net domestic migration from three states to its north: Washington, Utah, and North Dakota.
- Kentucky was the largest attractor of net domestic migration from two states to its south: Tennessee and Georgia.
- North Carolina was the largest attractor of net domestic migration from Virginia and Rhode Island.
- South Carolina was the largest attractor of net domestic migration from North Carolina and Vermont.
All other states besides those listed above were the largest attractors of net domestic migration from either zero states or just one state. The map does not name the leading destination of domestic migration into some states (shown in light grey) if they were within the margin of error of having zero (balanced) net migration with the leading destination.
Greener Pastures and Lower Taxes
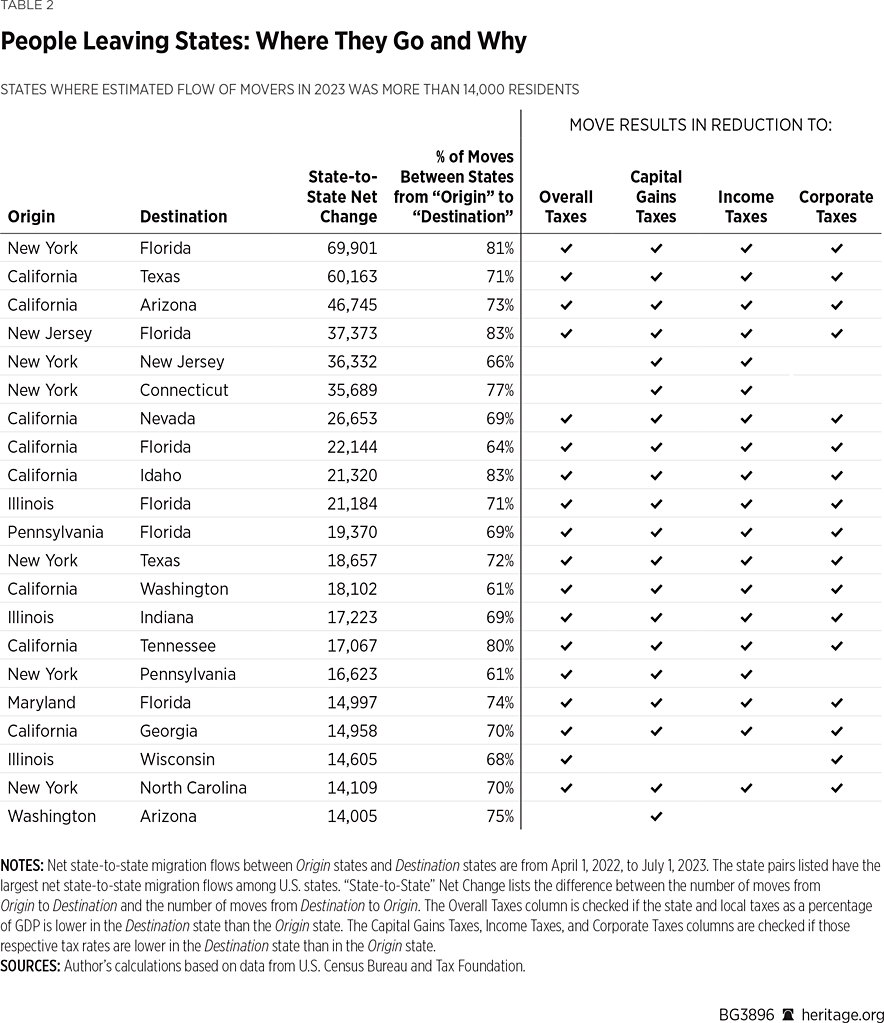
Table 2 shows each pair of states where the estimated net flow of movers in 2023 was more than 14,000 residents. In each row, the state listed as Origin is the one in the pair that lost 14,000 or more movers to the state that is listed as Destination. The flow of movers between most of the listed pairs of states was highly unbalanced, with an average of about 72 percent of moves going from the Origin to the Destination as opposed to 28 percent from Destination to the Origin. The Destination had lower taxes as a share of state gross domestic product (GDP) than the Origin had in 18 out of the 21 (86 percent) state pairs listed. More specifically, the Destination had a lower tax rate on capital gains than the Origin did 20 times, a lower income tax rate 19 times, and a lower corporate tax rate 17 times.REF
From 2020 to 2023, this pattern of Americans moving to states with lower taxes has resulted in large population shifts. The 10 states that have the highest taxes as a share of state GDP (the top quintile) lost 2.3 million residents to interstate migration, and the 10 states with the lowest taxes (the bottom quintile) gained 2.1 million residents from interstate migration. The quintile with the second-highest taxes lost about 430,000 residents, the middle quintile gained about 28,000 residents, and the quintile with the second-lowest taxes gained about 651,000 residents.REF
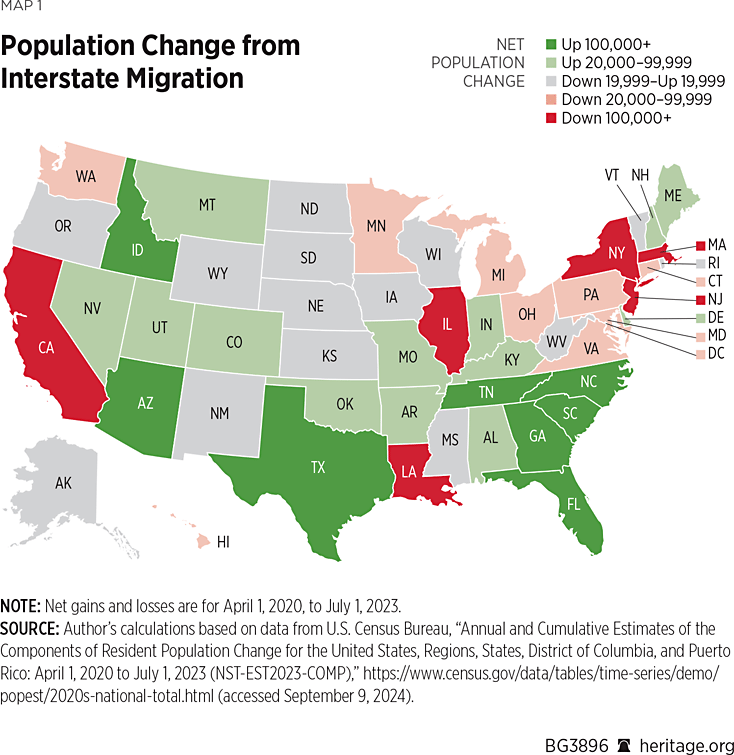
Chart 3 summarizes the three-year net domestic migration data for all 50 states (plus Washington, DC) by the states’ tax quintile. The left column shows the total net domestic migration of each state, sorted from the state with the highest inmigration (Florida) to the state with the highest outmigration (California). Dark green bars represent states with taxes as a share of state GDP in the bottom 20 percent of all states, and the dark red bars represent states with taxes as a share of state GDP in the top 20 percent of all states. As the chart shows, low-tax states were far more likely to gain population from domestic migration.
Combined, the 25 states with above-median taxes as a share of state GDP lost more than 2.8 million residents to the states with below-median taxes.REF That is more people than could fit into each of the 30 NFL stadiums and 29 NBA arenas in the United States and Canada combined.REF
Domestic Migration and Different Tax Types
All taxes impose some degree of burden on individuals and the economy, taking money away from the people who earned it and giving it to the government to spend or redistribute. However, the harm caused by taxes extends beyond just the dollars that are transferred from private hands to the government. The harm of taxes also includes or can include:
- Discouragement of work, saving, investment, entrepreneurship, and other productive behaviors;
- Encouragement of tax avoidance (including moving for tax reasons);
- Distortion of price signals relied on by producers and consumers;
- Costly administration and compliance burdens;
- Empowerment of the government to pick winners and losers; and
- Encouragement of lobbying, corruption, and black markets.
Not all types of taxes are equally harmful. The least damaging taxes tend to be broadly applied, clear, and simple. The most damaging taxes tend to be selectively applied and complicated. The harm of an incremental increase in a tax is greater when it is added to an already high tax rate.REF
Many researchers have concluded that taxes on income—including ordinary income taxes, capital gains taxes, and corporate income taxes—are the most harmful common type of tax.REF Taxes on income target and discourage productive activity, are difficult to administer and comply with, and are selectively applied—with arbitrary rates, exemptions, thresholds, and preferential credits.
The data on the interstate migration decisions of Americans support the idea that taxes on income are especially harmful. Even though states collect more revenue from property taxes and sales taxes, differences in tax rates on income (ordinary, capital gains, and corporate) better explain state-to-state migration. High taxes on income, in particular, appear to drive people out of states.REF
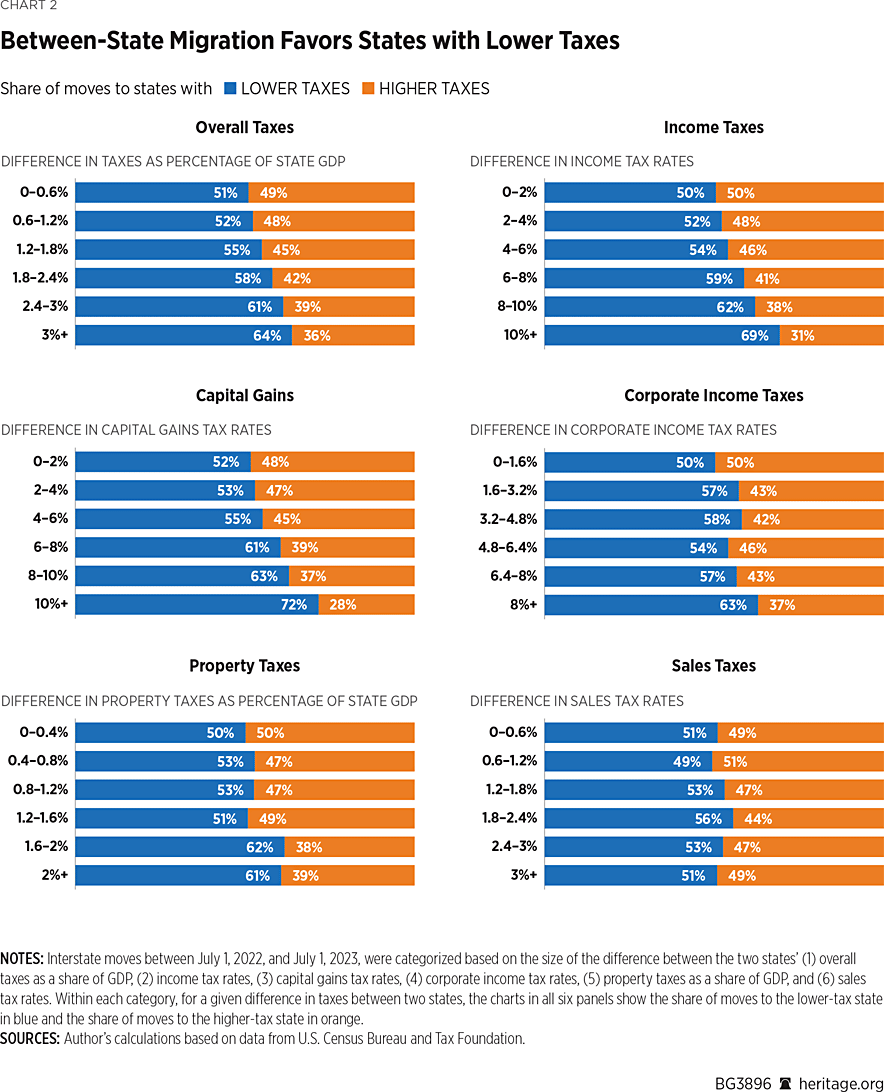
Chart 2 shows the balance of moves between higher-tax states and lower-tax states based on the difference in the level of taxes or the tax rates. For example, the top left panel shows that when the difference between two states’ overall taxes as a percentage of GDP is less than 0.6 percent, 51 percent of the state-to-state moves are to the lower-tax state and 49 percent are to the higher-tax state. But when the difference between the two states’ tax collections is more than 3 percent of GDP, 63.8 percent of the moves are to the lower-tax state and only 36.2 percent are to the higher-tax state.REF
The top right and middle left panels of Chart 2 show that for the largest differences in tax rates on ordinary income and capital gains income (10 percentage points or more), about 70 percent of the moves between the states are to the lower-tax state. Where there are large differences in the corporate rate (8 percentage points or more), the state-to-state migration is somewhat more balanced, with 62.9 percent of moves going into the state with the lower corporate tax rate.REF However, corporate income taxes account for only about one-seventh as much state and local tax revenue as do individual income taxes. Dollar for dollar, corporate taxes may lead to more economic damage and more outmigration than other taxes on income do.
The results are somewhat less stark for property taxes, as shown in the bottom left panel, even though property taxes are the largest source of state and local tax revenue. For state pairs where the difference between property taxes is more than 1.6 percent of GDP, about 61 percent of the moves are into the lower-tax state.REF
Based on the bottom right panel, differences in sales tax rates do not appear to be a major driver of migration. Americans who moved in 2023 were almost as likely to move to a state with a higher sales tax as to a state with a lower sales tax (48.3 percent versus 51.7 percent). The ratio is not meaningfully different when the gap between sales tax rates is large.REF
Do Tax Differences Directly Cause Interstate Migration?
Despite Americans’ strong propensity to move from high-tax states to low-tax states, some analysts suggest that taxes are only a minor factor in Americans’ decisions to move across state lines. They cite the Census Bureau’s ASEC survey, which asks respondents who lived in different residences a year ago about the main reason for their moves.REF Most respondents select Housing, Family, or Employment as the reason for their moves. Notably, the survey does not list taxes among its 19 options (except to the extent it is included in “Other Reason”).REF However, even if the survey did include Taxes as an option, it may not be among the most cited reasons for moving, because the indirect effects of high taxes may be worse and more widespread than the direct tax payments themselves.
It has been said that “[t]he art of taxation consists in so plucking the goose as to obtain the largest possible amount of feathers with the smallest amount of hissing.”REF In that spirit, lawmakers have designed taxes to be less obvious to individuals. Instead of making people pay a single painful lump sum income tax at the end of the year, governments typically make employers withhold income from their workers’ paychecks. Gasoline taxes are baked into the price at the pump. For many homeowners, property taxes are folded into their monthly mortgage payments. Governments enlist businesses to collect a large volume of overall tax collections, so less observant residents may blame businesses for taxes they pass along, or they may simply lament how little they are able to buy with their paychecks.
Second-order effects of taxes also drive migration decisions, especially for lower- and middle-income households that may pay less in state income taxes themselves. The person who directly pays a state tax is seldom the only one impacted by it, because the residents of a state are interconnected through housing markets, product markets, and labor markets. Property tax hikes force landlords to raise rents and discourage new construction and property improvements. The lack of new construction puts upward pressure on housing prices and rents and downward pressure on construction wages and the quality of housing. Tax hikes on business and capital income drive away investment and squelch entrepreneurship and business formation. This results in lower wages and higher rates of joblessness. Tax hikes on wage and salary income drive workers out of the labor force and drive motivated workers to look for jobs in other states.
Low-tax states attract residents from all income bands, and high-tax states repel them. Even the lowest-income Americans (those making less than $10,000 in annual income) are more likely to move out of high-tax states than to move to them. As Chart 3 implies, more than 53 such very-low-income individuals move out of high-tax states for every 47 who move in.REF (The ratio is nearly reversed for low-tax states). Conventional wisdom might suggest that high taxes and high government spending would be a net benefit to low-income residents. At least the interstate migration data suggest that is not the case.REF The higher cost of living caused significantly by tax policy bears much of the blame.
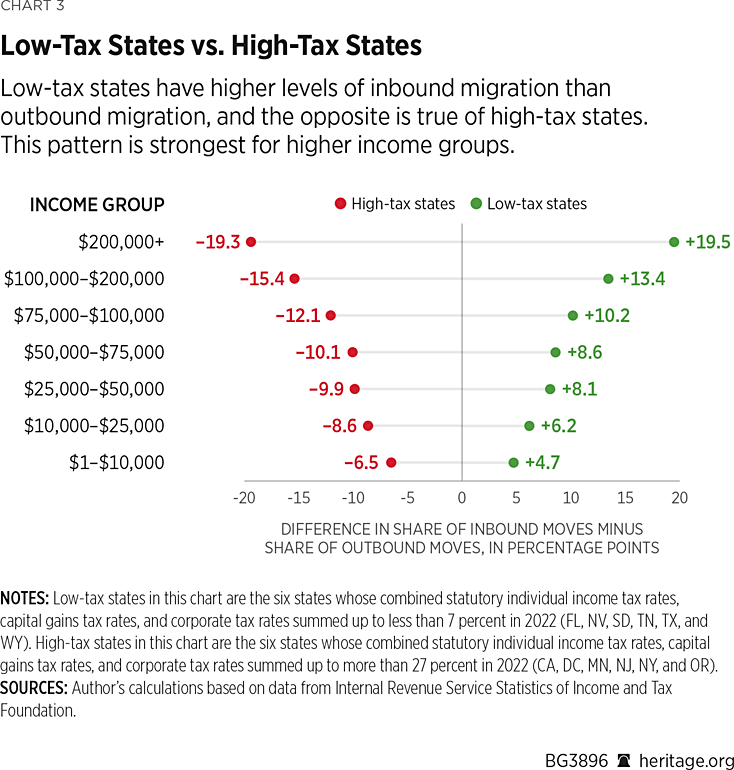
The split between inbound moves and outbound moves is highest for the highest income category, though. There are nearly 60 people making $200,000 or more who move out of high-tax states for every 40 who move in. (The ratio is reversed for low-tax states.REF) High earners pay a disproportionate amount of taxes and so are more directly affected by taxes. It stands to reason that high-income individuals would be more likely to flee from high-tax states. However, the mobility of high-income individuals has important ramifications. The exodus of high-income individuals blunts the potential revenue gains from state tax hikes. Shortly after Washington State added a new 7 percent capital gains tax (and at the same time the state was considering a new, first-of-its-kind wealth tax), Jeff Bezos moved his residency from Washington to zero-income-tax Florida. Bezos’s move out of Washington may ultimately cost the state billions—if not tens of billions—of dollars of tax revenue. Bezos cited family reasons for his change in residency, but it is hard to imagine taxes were not a consideration.REF Florida has been particularly successful at attracting high-income individuals. Those making $200,000 or more were nearly three times as likely (74 percent vs. 26 percent) to move to Florida as to move out of Florida.REF
The direct reason that everyday people may cite for leaving a state may be related to the housing market, the cost of living, or differences in job opportunities—but high taxes and bad governance exacerbate problems in all these areas. The consistency with which Americans gravitate toward lower-tax states defies random chance, so the connection between high taxes and outmigration cannot be dismissed.
However, good policies also tend to run in packs, so it would be a mistake to conclude that tax policy alone fully causes the net migration between high-tax states and low-tax states. Governments that keep the taxes on their citizens low are more likely to have other sound policies. They are more likely to act as faithful stewards of taxpayer dollars, focusing their attention on the core functions of government and avoiding excessive regulations or job-killing welfare programs. States that impose high taxes have fewer safeguards against government waste, regulatory meddling, and bureaucratic red tape.
Policy Recommendations
Looming expirations of federal tax and spending provisions could increase the pressure on state governments’ budgets.REF State lawmakers should resist tax increases and should lower taxes to the extent feasible. State lawmakers should:
- Avoid increases in taxes on ordinary income, capital gains income, and corporate income;
- Reduce tax rates on income or eliminate income taxes altogether where feasible;
- Cut or reduce growth to their budgets to facilitate reduced taxes;
- Consider tax triggers to phase in tax rate reductions as certain budget thresholds are met if lawmakers are concerned about their states’ ability to maintain balanced budgets; and
- Consider reductions to property taxes to the extent their states’ taxes on income are competitive.
In addition, federal tax deductions for state and local taxes (SALT) and exclusions for municipal bond interest act as indirect subsidies for state and local governments that increase taxes and spending. To eliminate this bias and encourage tax competition among the states, Congress should:
- Reduce the current $10,000 cap on the SALT deduction or eliminate the SALT deduction altogether,
- Cap or eliminate the corporate SALT deduction to prevent states from allowing workarounds to the SALT cap, and
- Eliminate municipal bond exclusions.
Conclusion
People vote with their feet. If migration is any indication, most people prefer living in low-tax states, where taxpayers—not politicians—have more control over how money is spent in the economy. Just as the states compete, the United States competes with other countries around the world to attract and retain the capital investments that facilitate job creation and prevent factories from moving overseas. Because Americans pay much more in federal taxes than they do in state and local taxes combined, Congress has the power to reduce Americans’ taxes even more than state lawmakers do.
Taxes affect Americans beyond just transferring some of their own money to the government. Americans are also affected when their employers must cut back on wage increases and hiring. They are affected when their landlords raise rent. They are affected when their favorite restaurants are driven out of business. They are affected when their friends or relatives move away to escape the high taxes or for better job opportunities. It all adds up and causes real struggles and hardships in people’s lives. State and federal lawmakers should recognize and respond to taxpayers’ revealed preference for lower taxes and should act as careful stewards of Americans’ tax dollars.
Preston A. Brashers is Research Fellow for Tax Policy in the Grover M. Hermann Center for the Federal Budget at The Heritage Foundation.


