
Amid yesterday’s equity meltup, ETFs accounted for 34% of the overall tape (vs an YTD avg 28%) as the desk skewed better to buy driven by a mix of domestic, international and sector exposures.

However, the action was not uniform, because unlike recent weeks which have seen aggressive equity ETF selling/shorting offset by a surge in ETF buying, yesterday the flows were flipped.
As Goldman ETF specialist Chris Luccas writes, over the past few weeks, Goldman has seen demand for spot-exposure (GLD), across a wide range of clients, triggered by the broader outperformance and a conduit to manage uncertainty. However, yesterday’s price action appeared to be release valve after the S&P cemented its 3rd best session in the past 2 years.
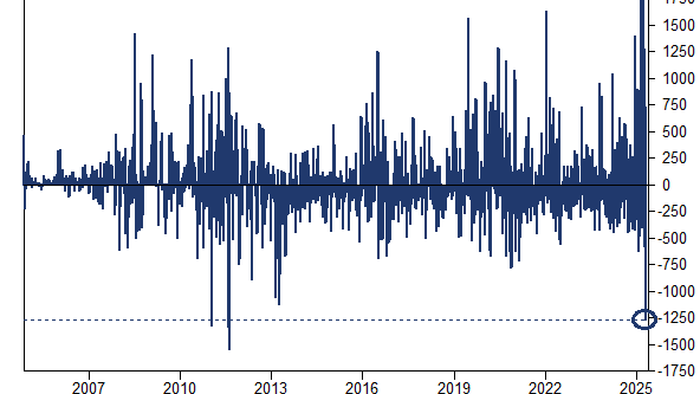
Cutting to the chase, it was an outsized session for GLD as the fund concluded the session as the 3rd most-traded ETF (which is unusual GLD) and witnessed its 3rd largest notional trading session since its inception in 2004. Volumes were notable on the desk as Goldman skewed (much) better to sell (mostly long sales) across spot (GLD) and the miners complex (GDX, GDXJ), with supply accelerating into the latter half of the session. As shown in the chart below, within primary market flows, GLD registered a -$1.3bn outflow (its largest daily outflow since the record 2011 slam when tremendous SNB intervention set a ceiling for gold that lasted nearly a decade) and GDX faced a -$200mm redemption (its worst daily outflow in the past 12 months).

With regard to price action, spot performance versus S&P was at one of its widest measures in the past 5 years..

The ETF slam goes to show just how much easier it is to push the gold price around using paper instead of physical, but it also suggests that such bursts of selling may be limited. As Goldman notes, while gold ETF AUM is at highs, the amount of gold held by ETFs as an aggregate is below levels witnessed in 2020. Record AUM in GLD has been entirely a function of price appreciation versus subscriptions (even though inflows have been robust on the year).

Meanwhile, as regular readers are well aware, while occasional gold ETF liquidations are inevitable, the ETF sectors has a lot of catching up to do with the actual price, as shown in the next chart mapping aggregate ETF holdings vs spot price. As such, while liquidation days like yesterday (and today) are to be expected, it is inevitable that the ETF bid will eventually appear.

Finally, there was good news for gold bulls: while the overbought selloff – driven by ETF liquidations – in the last 2 days was remarkable and at 4% was one of the worst 2-day drops on record, physical demand out of China appeared like clockwork the moment China came online, and helped push gold about $40 higher in the span of minutes, and about $100 higher compared to this morning’s lows.

Expect much more of the same as China’s population increasingly allocates its net worth into the yellow metal as we discussed yesterday.
Loading…


