The Issue
In the Backgrounder “Reducing Regulations Produces Strong Economic Growth Responses,” we produced estimates of the economic effects predicted with a freeze in federal regulations. This Factsheet contains estimates of the effect of a regulatory freeze on the federal budget. A freeze would mean no change in the current number of regulatory restrictions, which maintains restrictions below forecast levels.
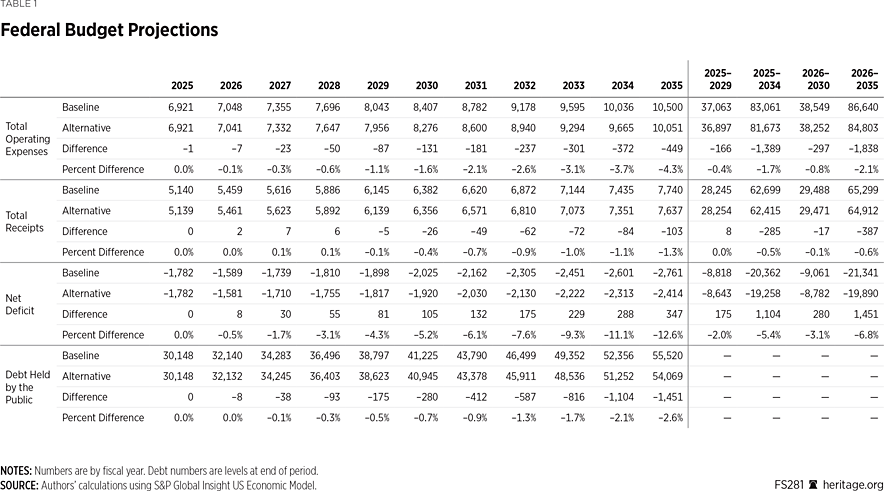
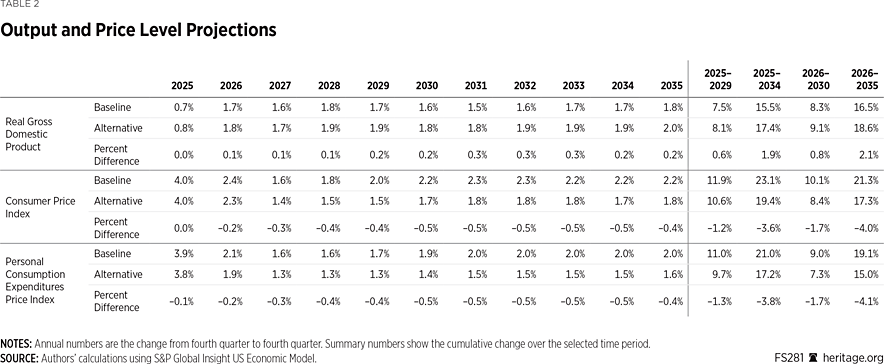
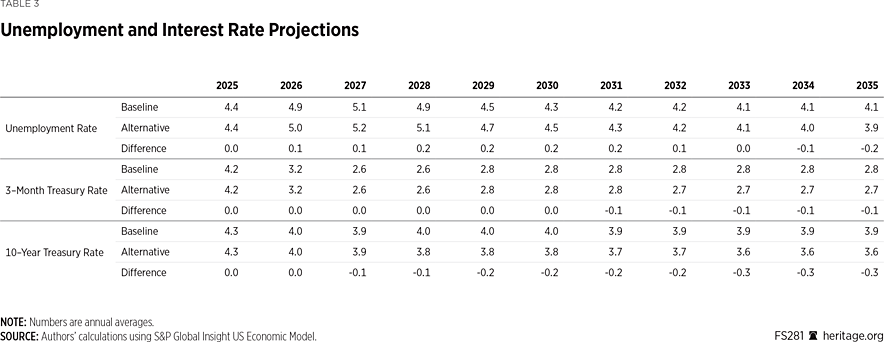
We find that a regulatory freeze would reduce the federal deficit by $1.1 trillion over the 2025–2034 budget window and $1.4 trillion over the 2026–2035 budget window. Top line budgetary results are shown in Table 1. Changes in economic output and prices are shown in Table 2. Key rates are shown in Table 3.
Freezing regulation raises real gross domestic product (GDP) growth forecasts. By 2035, real GDP is 2.1 percent higher. Additionally, freezing regulation is disinflationary. By 2035, the Consumer Price Index is 3.6 percent lower. Disinflation is accompanied by reduced interest rates and lower interest expense. Revenues decrease slightly because of slower nominal personal income growth (though real adjusted personal disposable income increases). However, the significant reduction in expenses reduces the deficit over the budget window.
Congress should consider ways to constrain the growth in regulation as part of the reconciliation process. The potential economic and fiscal benefits are substantial. Should Congress request an official score from the Congressional Budget Office (CBO), the estimates in this Factsheet could serve as a guide.
How the Economic and Budgetary Estimates Were Constructed
For these estimates, we used Standard & Poor’s (S&P) Global Insight US Economic Model, which the CBO uses to produce dynamic estimates of budgets and fiscal legislation. The S&P model does not have regulation as an input, so we translated our earlier results to fit the model.
Specifically, we captured the effects of a regulatory freeze through increased total factor productivity (TFP). TFP is calculated as a residual—the parts of output growth not explained by input growth—which includes unmeasured costs like regulatory compliance costs. Reduced regulatory compliance costs would mean that the same inputs can produce more output. Slower than forecast regulatory growth would mean faster TFP growth.
The estimates of real GDP, real investment, and hours worked from our previous model were the starting point. We used the median growth rates in each of the series to construct an estimate of total factor productivity using an equation similar to the process used by the Bureau of Labor Statistics. That equation produces TFP series in both baseline and alternate scenarios.
We translated the TFP series because S&P uses a slightly different production function in its model. Specifically, we take the ratio of TFP growth between the alternate and baseline scenarios from the earlier model and multiply that by the baseline TFP growth in the S&P model to produce a comparable alternate TFP series. The translation is good because it produces the same 1.8 percent increase in real GDP after 10 years that we forecast using our earlier model.


